This blog post delves into the “Sectors of the Indian Economy,” a key chapter in Class 10 Economics. Students will learn about the three main sectors. These are primary (agriculture and related activities), secondary (industry and manufacturing), and tertiary (services). They will also understand their roles, interdependence, and contribution to India’s GDP and employment. The post also covers the important distinctions between organised and unorganised sectors. It discusses public and private sectors. Current trends, such as the rising significance of the service sector, are explained. Issues like disguised unemployment and the impact of schemes like MGNREGA are also covered. This guide is clear and concise. It uses NCERT concepts to help students grasp the fundamentals. They can prepare effectively for their exams. It covers essential topics such as sector classification, economic production, employment challenges, and sectoral shifts in India.
Quick Revision Notes for Exam
Understanding Sectors
Economic activities are sorted into categories called sectors, helping us make sense of what people do for a living and how the economy runs. Sectors can be classified based on several factors such as the kind of work done, employment terms, or ownership of enterprises.
The Three Main Sectors
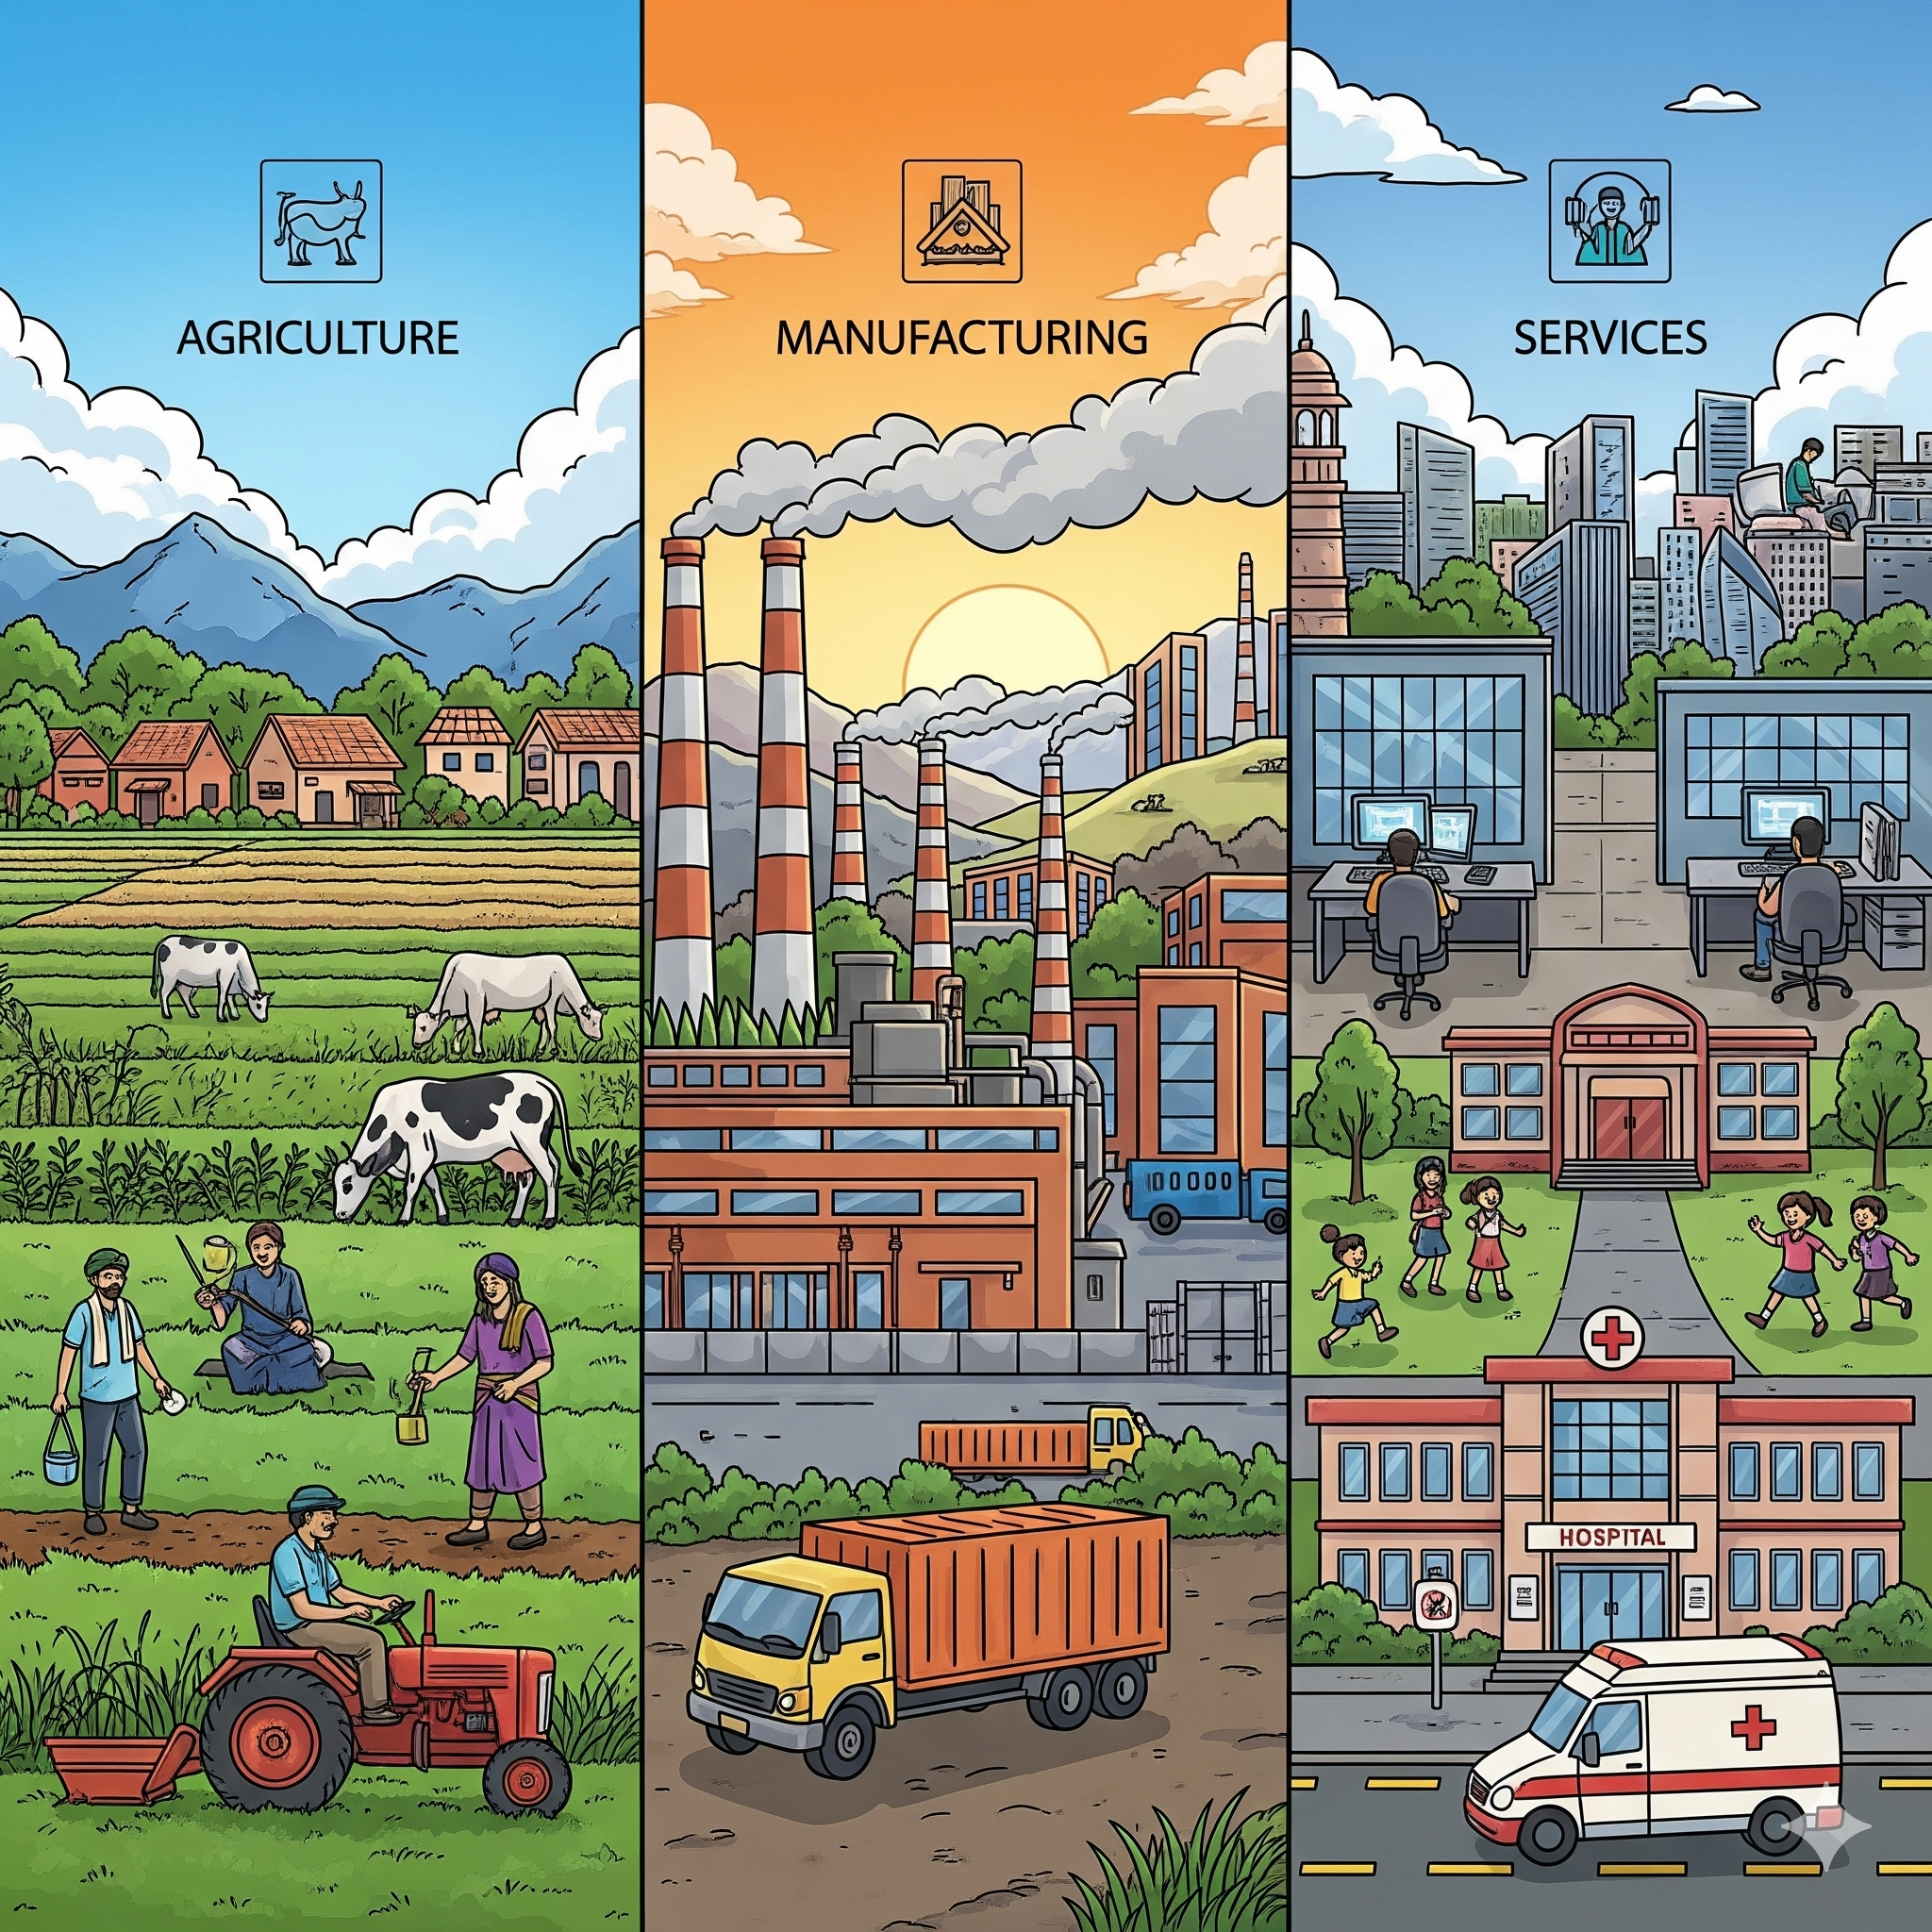
Primary Sector
This sector deals with extracting or using natural resources directly. Think farming, fishing, dairy, mining, and forestry—anything where nature is at the heart of production.
Secondary Sector
Here, raw materials are transformed into finished products. Activities include manufacturing, construction, and processing. Factories that turn raw cotton into fabric, or sugarcane into sugar, are part of this group.
Tertiary Sector
Known as the service sector, it supports both production and everyday life but doesn’t produce tangible goods. This includes transport, trade, healthcare, education, banking, and IT services. It’s essential for the smooth functioning and growth of the primary and secondary sectors.
Relationship and Importance
No sector works in isolation. For example, industries need raw materials from farms, while both farmers and manufacturers rely on transport, storage, and sales services. These sectors form a tightly knit web, each supporting the others.
Measuring Economic Contribution
To understand how much each sector contributes, economists use the value of final goods and services produced, avoiding double counting. This sum for the nation over a year is called GDP (Gross Domestic Product). Later, a similar measure called GVA (Gross Value Added) considers sector-specific contributions, taking taxes and subsidies into account.
Shifts in Sectoral Importance
As economies develop, the focus often shifts across sectors:
- In early stages, agriculture dominates.
- With industrial growth, manufacturing becomes central.
- Eventually, the service sector takes the lead, both in output and job creation.
In India, primary sector jobs still account for the majority, but the service sector has taken the lead in economic contribution.
Patterns in Employment
Despite the service sector’s dominance in production, employment is still heavily skewed towards agriculture. Not all workers in the primary sector are fully utilized, leading to disguised unemployment—more people working than necessary, especially on farms. This kind of underemployment is not immediately visible, as everyone seems engaged, but productivity per person is low.
Addressing Unemployment
- Expanding irrigation and rural infrastructure can boost agricultural jobs.
- Setting up small industries and rural services provides alternative employment.
- Programs like MGNREGA guarantee rural families up to 100 days of paid work a year, helping those in need and promoting productive community projects.
- Growth areas like education, health, and tourism can generate significant new jobs if properly supported.
Organised vs Unorganised Sectors
Organised Sector
Jobs here are formal and secure. Workers receive regular wages, holidays, and benefits like pensions, medical care, and provident funds. Examples include government offices and big private companies.
Unorganised Sector
Work here is informal and often insecure. Workers get lower, irregular wages and have little job security or perks. Most small farmers, street vendors, daily-wage laborers, and helpers fall under this category.
Public and Private Sectors
Public Sector
Run by the government, this sector is responsible for large-scale infrastructure, essential services such as railways, roads, health, and education. The aim is overall welfare, not just profit.
Private Sector
Privately owned businesses operate here, focusing on profit. They include shops, factories, and service providers—from large corporations to tiny kiosks.
Key Concepts & Terms
- Primary, Secondary, Tertiary Sectors
- Gross Domestic Product (GDP)
- Gross Value Added (GVA)
- Organised and Unorganised Sectors
- Public and Private Sectors
- Disguised/Underemployment
- MGNREGA (Employment Guarantee Scheme)
Quick Exam Pointers
- Always use examples to explain sector-based answers.
- Highlight how sectors are interconnected.
- Differentiate between various forms of unemployment.
- Compare organised and unorganised sectors with real-life illustrations.
- Explain the necessity of public sector activities and government intervention.
Solution to Text-based Questions
Table 2.1: Examples of Economic Activities Solved
| EXAMPLE | WHAT DOES THIS SHOW? |
|---|---|
| Imagine what would happen if farmers refuse to sell sugarcane to a particular sugar mill. The mill will have to shut down. | This is an example of the secondary or industrial sector being dependent on the primary. |
| Imagine what would happen to cotton cultivation if companies decide not to buy from the Indian market and import all cotton they need from other countries. Indian cotton cultivation will become less profitable and the farmers may even go bankrupt, if they cannot quickly switch to other crops. Cotton prices will fall. | This shows that the primary sector depends on the market demand created by the secondary sector. If industries do not buy agricultural goods, farmers are affected. |
| Farmers buy many goods such as tractors, pumpsets, electricity, pesticides and fertilisers. Imagine what would happen if the price of fertilisers or pumpsets go up. Cost of cultivation of the farmers will rise and their profits will be reduced. | This highlights that the primary sector relies on the secondary sector for essential tools and supplies. A rise in prices in the secondary sector impacts the profitability of farmers. |
| People working in industrial and service sectors need food. Imagine what would happen if there is a strike by transporters and lorries refuse to take vegetables, milk, etc. from rural areas. Food will become scarce in urban areas whereas farmers will be unable to sell their products. | This shows that the secondary and tertiary sectors are dependent on the primary for food supply. It also highlights the importance of smooth transportation in the tertiary sector. This is essential for everyone. |
LET’S WORK THESE OUT (Part 1)
2. Difference Between Primary, Secondary, and Tertiary Sectors (with new examples)
- Primary Sector
Involves extraction and collection of natural resources.
Example: Mining of iron ore, hunting, gathering honey. - Secondary Sector
Processes raw materials into finished or semi-finished goods.
Example: Car manufacturing, bread baking, ceramic tile production. - Tertiary Sector
Provides services rather than goods, supporting the other sectors and everyday life.
Example: Teaching in schools, hotel services, transporting people via taxi.
3. Classification of Occupations
| Occupation | Sector |
|---|---|
| Tailor | Secondary |
| Workers in match factory | Secondary |
| Basket weaver | Secondary |
| Flower cultivator | Primary |
| Milk vendor | Tertiary |
| Fishermen | Primary |
| Priest | Tertiary |
| Courier | Tertiary |
| Moneylender | Tertiary |
| Gardener | Primary |
| Potter | Secondary |
| Bee-keeper | Primary |
| Astronaut | Tertiary |
| Call centre employee | Tertiary |
Note:
- “Tailor”, “Basket weaver”, and “Potter”: They transform raw materials into usable products = Secondary.
- “Flower cultivator”, “Fishermen”, “Gardener”, “Bee-keeper”: Directly use natural resources = Primary.
- “Milk vendor”, “Priest”, “Courier”, “Moneylender”, “Astronaut”, “Call centre employee”: These roles provide services. They connect other sectors. They also work in non-production roles = Tertiary.
4. Classification of Students in Primary, Secondary (Junior/Senior)
Criterion Used:
The classification is based on either age group or class/grade level.
Usefulness:
This classification is useful. It helps in grouping students according to their stage of learning, maturity, and curriculum requirements. This approach allows schools to design and deliver age-appropriate education and activities for different groups. It ensures effective teaching. This leads to better student development.
LET’S WORK THESE OUT (Part 2)
1. What does the history of developed countries indicate about the shifts that have taken place between sectors?
The history of developed countries shows that as they progressed, the importance of sectors changed. Initially, the primary sector (agriculture) was the main source of production and employment. With industrialization, the secondary sector (industry) grew and became dominant. Later, as economies developed further, the tertiary sector (services) became the largest contributor to production and employment.
2. Correct and arrange the important aspects for calculating GDP from this jumble:
“To calculate GDP, we add the values of goods and services produced in the economy during a year. We only count the final goods and services to avoid double counting. We sum up the value of all goods and services produced within the country during the given period.”
3. Discuss with your teacher how you could calculate the total value of a good or service by using the method of value added at each stage.
The value added method calculates GDP by adding the extra value created at every stage of production. For example, when wheat is sold by a farmer, that is the first value added. When the wheat is made into flour by a miller, the added value is the difference between the value of flour and the cost of wheat. When the flour is used to make bread, the baker adds further value. The total value added at all stages gives the final value of the product. This method avoids counting the value of intermediate goods multiple times.
LET’S WORK THESE OUT (Part 3)
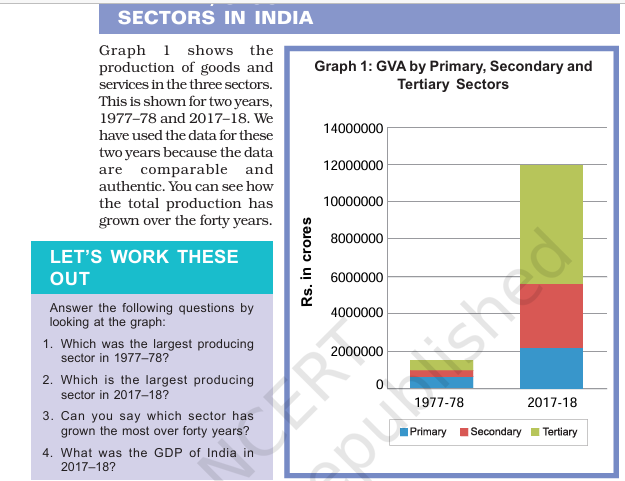
1. Which was the largest producing sector in 1977–78?
The largest producing sector in 1977–78 was the primary sector.
2. Which is the largest producing sector in 2017–18?
The largest producing sector in 2017–18 is the tertiary sector.
3. Can you say which sector has grown the most over forty years?
The tertiary sector has grown the most over forty years.
4. What was the GDP of India in 2017–18?
The GDP of India in 2017–18 was about ₹ 140,00,000 crore.
LET’S WORK THESE OUT (Part 4)
1. Complete the table using the data given in Graphs 2 and 3
| 1977-78 | 2017-18 | |
|---|---|---|
| Share in Gross Value Added (GVA) | 44% | 16% |
| Share in employment | 71% | 44% |
What are the changes that you observe in the primary sector over a span of forty years?
The share of the primary sector in both GVA and employment has decreased over forty years. Now, fewer people work in the primary sector. It produces a much smaller part of India’s income compared to the past.CHAPTER-2-SECTORS-OF-THE-INDIAN-ECONOMY-Class-10-Economics.pdf+1
2. Choose the correct answer:
Underemployment occurs when people
(iii) are working less than what they are capable of doing.
3. Compare and contrast the changes in India with the pattern that was observed for developed countries. What kind of changes between sectors were desired but did not happen in India?
In developed countries, people shifted from the primary sector to the secondary sector. They then moved to the tertiary sectors, with most people now working in services. In India, production has grown in the secondary and tertiary sectors. However, a large part of the population still works in agriculture. The desired shift of employment from primary to other sectors has not happened fully in India.image.jpg+1
4. Why should we be worried about underemployment?
We should be worried about underemployment because workers are not able to use their full potential. This means resources are wasted, people’s incomes are low, and it slows down the country’s economic growth.CHAPTER-2-SECTORS-OF-THE-INDIAN-ECONOMY-Class-10-Economics.pdf
Thank you for pointing that out. I understand your feedback and will not include references or citations in your output, as you requested. Here are the answers in the simplest English, without any references or citations:
LET’S WORK THESE OUT (Part 5)
1. Why do you think MGNREGA 2005 is referred to as ‘Right to work’?
MGNREGA 2005 is called the ‘Right to work’ because it gives every rural person who wants to work a legal right to get 100 days of paid work each year. If work is not given, the person can get an unemployment allowance from the government.
2. Imagine that you are the village head. In that capacity suggest some activities that you think should be taken up under this Act that would also increase the income of people? Discuss.
As the village head, I would suggest building canals, ponds, roads, planting trees, cleaning the village, and digging wells. These activities provide jobs and also make the village better for farming and daily life, helping people earn more in the long run.
3. How would income and employment increase if farmers were provided with irrigation and marketing facilities?
If farmers get irrigation, they can grow more crops and get harvests even without rains. Good marketing means farmers can sell their produce at better prices. This helps farmers earn more money and gives more people jobs in growing, processing, and selling farm goods.
4. In what ways can employment be increased in urban areas?
Employment in cities can be increased by starting more small businesses, encouraging start-ups, building roads and houses, offering skill training, and supporting service businesses like delivery, shops, and IT companies. This creates more jobs for city people.
Here are the answers to the questions in the screenshot:
LET’S WORK THESE OUT (Part 6)
1. Look at the following examples. Which of these are unorganised sector activities?
- (ii) A headload worker carrying a bag of cement on his back in a market
- (iii) A farmer irrigating her field
- (v) A daily wage labourer working under a contractor
- (vii) A handloom weaver working in her house
2. Talk to someone who has a regular job in the organised sector and another who works in the unorganised sector. Compare and contrast their working conditions in all aspects.
A person in the organised sector gets a regular salary, job security, holidays, and other benefits like medical and provident fund. Their work hours are fixed and they get paid leave. In contrast, someone in the unorganised sector has irregular work and income, no job security, no paid leave, often long hours, and no medical or retirement benefits. Their work is less protected by law.
3. How would you distinguish between organised and unorganised sectors? Explain in your own words.
The organised sector follows government rules, gives regular jobs and benefits, and ensures job security. The unorganised sector has small and scattered workplaces, does not follow rules properly, has irregular jobs and payments, and there is no job security or benefits.
4. The table below shows the estimated number of workers in India in the organised and unorganised sectors in the late 1990s. Read the table carefully. Fill in the missing data and answer the questions that follow.
| Sector | Organised | Unorganised | Total |
|---|---|---|---|
| Primary | 1 | 231 | 232 |
| Secondary | 41 | 74 | 115 |
| Tertiary | 40 | 88 | 128 |
| Total | 82 | 393 | 475 |
- What is the percentage of people in the unorganised sector in agriculture?
Answer: (231 / 232) × 100 = 99.57%, nearly 100%. - Do you agree that agriculture is an unorganised sector activity? Why?
Yes, agriculture is mostly unorganised because farming is done by small and marginal farmers, there are no fixed rules, wages are not regular, and there is no job security. - If we look at the country as a whole, we find that _____% of the workers in India are in the unorganised sector. Organised sector employment is available to only about _____% of the workers in India.
Answer: Approximately 93% of workers are in the unorganised sector and only 7% are in the organised sector.
Here are the answers to the 24 exercises from the attached PDF, organized by question number, with simple language and short sentences.
EXERCISES
1. Fill in the blanks using the correct option given in the bracket:
(i) Employment in the service sector ______ as production. (has / has not)
Answer: has
(ii) Workers in the ______ sector do not produce goods. (tertiary / agricultural)
Answer: tertiary
(iii) Most of the workers in the ______ sector enjoy job security. (organised / unorganised)
Answer: organised
(iv) A ______ proportion of labourers in India are working in the unorganised sector. (large / small)
Answer: large
(v) Cotton is a ______ product and cloth is a ______ product. [natural / manufactured]
Answer: natural, manufactured
(vi) The activities in primary, secondary and tertiary sectors are ______. [independent / interdependent]
Answer: interdependent
2. Choose the most appropriate answer.
(a) The sectors are classified into public and private sector on the basis of:
Answer: (iii) ownership of enterprises
(d) In terms of GVA the share of tertiary sector in 2017–18 is between
Answer: (iv) 60 to 70 per cent
3. Match the following:
Problems faced by farming sector:
- Unirrigated land – (d) Construction of canals by the government
- Low prices for crops – (b) Cooperative marketing societies
- Debt burden – (e) Banks to provide credit with low interest
- No job in the off season – (a) Setting up agro-based mills
- Compelled to sell their grains to the local traders soon after harvest – (c) Procurement of food grains by government
4. Find the odd one out and say why.
(i) Tourist guide, dhobi, tailor, potter
Answer: Tailor (because others are service providers, tailor is more of manufacturing)
(ii) Teacher, doctor, vegetable vendor, lawyer
Answer: Vegetable vendor (others are professionals)
(iii) Postman, cobbler, soldier, police constable
Answer: Cobbler (others are government jobs)
(iv) MTNL, Indian Railways, Air India, Jet Airways, All India Radio
Answer: Jet Airways (private sector, others are public sector)
5. A research scholar looked at the working people in the city of Surat and found the following. Complete the table.
| Place of work | Nature of employment | Percentage of working people |
|---|---|---|
| In offices and factories | Organised | 20% |
| Own shops, office, clinics | Organised | 15% |
| People working on the street, construction workers, domestic workers | Unorganised | 15% |
| Working in small workshops | Unorganised | 50% |
Percentage of workers in the unorganised sector in this city = 65%.
6. Do you think the classification of economic activities into primary, secondary and tertiary is useful? Explain how.
Answer: Yes, it helps us understand the kind of work people do. It shows how economy changes over time. It also tells us which sector is growing or declining.
7. For each of the sectors that we came across in this chapter why should one focus on employment and GVA? Could there be other issues which should be examined? Discuss.
Answer: Employment shows how many jobs are in a sector. GVA shows the value of goods and services produced. Other issues are income, working conditions and growth potential.
8. Make a long list of all kinds of work that you find adults around you doing for a living. In what way can you classify them? Explain your choice.
Answer: Work like farming, tailoring, teaching, shopkeeping, carpentry, etc. These can be classified into primary (farming), secondary (tailoring, carpentry), tertiary (teaching, shopkeeping) sectors based on the kind of activity.
9. How is the tertiary sector different from other sectors? Illustrate with a few examples.
Answer: It provides services, not goods. Examples: teachers, doctors, drivers, shopkeepers.
10. What do you understand by disguised unemployment? Explain with an example each from urban and rural areas.
Answer: People appear to be working but produce less. Rural example: many family members working on small farm but not all needed. Urban example: painters or repair persons working irregularly, earning little.
11. Distinguish between open unemployment and disguised unemployment.
Answer: Open unemployment means no job, no work at all. Disguised unemployment means working but not fully used or needed.
12. “Tertiary sector is not playing any significant role in the development of Indian economy.” Do you agree? Give reasons in support of your answer.
Answer: No, the tertiary sector is important. It provides many jobs and services like health, education and transport. It contributes most to India’s GDP now.
13. Service sector in India employs two different kinds of people. Who are these?
Answer: One group is highly skilled and educated workers. Another group is low-paid workers like small shopkeepers, transport workers.
14. Workers are exploited in the unorganised sector. Do you agree with this view? Give reasons in support of your answer.
Answer: Yes, because their work is irregular, wages are low, no job security, and they get no benefits.
15. How are the activities in the economy classified on the basis of employment conditions?
Answer: Into organised sector with regular jobs and benefits; unorganised sector with irregular jobs and no benefits.
16. Compare the employment conditions prevailing in the organised and unorganised sectors.
Answer: Organised sector has fixed hours, regular salary, paid leave, and benefits. Unorganised sector has irregular work, low wages, no job security, and no benefits.
17. Explain the objective of implementing the MGNREGA 2005.
Answer: To provide at least 100 days of paid work to all rural households who want work, reducing unemployment and poverty.
18. Using examples from your area compare and contrast activities and functions of private and public sectors.
Answer: Public sector runs hospitals, schools, railways to serve many people. Private sector runs shops and factories to earn profit. Public sector focuses on social welfare; private focuses on profit.
19. Discuss and fill the following table giving one example each from your area.
| Well managed organisation | Badly managed organisation | |
|---|---|---|
| Public sector | Local government hospital | Some government schools |
| Private sector | Large private company | Unregulated small factories |
20. Give a few examples of public sector activities and explain why the government has taken them up.
Answer: Railways, post office, electricity. These are important services that need big investment and help all people, so government provides them.
21. Explain how public sector contributes to the economic development of a nation.
Answer: It provides essential services, jobs, and infrastructure. It supports poor and backward areas. It creates foundation for other sectors to grow.
22. The workers in the unorganised sector need protection on the following issues: wages, safety and health. Explain with examples.
Answer: They need fair and regular wages. Many work in unsafe conditions, like construction workers without helmets. They need health support because they lack medical benefits.
23. A study in Ahmedabad found that out of 15,00,000 workers in the city, 11,00,000 worked in the unorganised sector. The total income of the city in this year (1997-1998) was Rs 60,000 million. Out of this Rs 32,000 million was generated in the organised sector. Present this data as a table. What kind of ways should be thought of for generating more employment in the city?
| Sector | Number of Workers | Income (Rs million) |
|---|---|---|
| Organised | 4,00,000 | 32,000 |
| Unorganised | 11,00,000 | 28,000 |
| Total | 15,00,000 | 60,000 |
Ways to generate more employment: Promote small industries, support self-employment, improve vocational training, invest in infrastructure and services.
24. The following table gives the GVA in Rupees (Crores) by the three sectors.
| Year | Primary | Secondary | Tertiary |
|---|---|---|---|
| 2000 | 12,56,000 | 10,12,000 | 18,17,000 |
| 2013 | 17,87,000 | 24,59,000 | 46,30,000 |
(i) Calculate the share of the three sectors in GDP for 2000 and 2013.
- 2000 total: 12,56,000 + 10,12,000 + 18,17,000 = 40,85,000
- Primary: (12,56,000 / 40,85,000) × 100 ≈ 30.74%
- Secondary: (10,12,000 / 40,85,000) × 100 ≈ 24.77%
- Tertiary: (18,17,000 / 40,85,000) × 100 ≈ 44.49%
- 2013 total: 17,87,000 + 24,59,000 + 46,30,000 = 88,76,000
- Primary: (17,87,000 / 88,76,000) × 100 ≈ 20.14%
- Secondary: (24,59,000 / 88,76,000) × 100 ≈ 27.72%
- Tertiary: (46,30,000 / 88,76,000) × 100 ≈ 52.14%
(ii) The data can be shown in a bar chart with sectors as categories and their percentage shares for both years.
(iii) Conclusion: The tertiary sector’s share in GDP increased the most, showing the growing importance of the service sector. The primary sector declined, and the secondary sector slightly increased.
The Economics Faculty at SolvedNotes is a group of academic professionals specializing in the CBSE Class 9 and 10 Economics curriculum. We break down complex financial concepts from the NCERT textbooks ‘Economics’ and ‘Understanding Economic Development’. Our study notes simplify critical chapters like The Story of Village Palampur, People as Resource, Money and Credit, and Globalization. With a focus on understanding Sectors of the Indian Economy and Consumer Rights, we provide exam-oriented definitions, statistical analysis, and application-based solutions to help students score high in their Social Science Board Exams.